Dashboard
The operational overview screen — today's task load, completion rate, technician performance, and line availability. This is where most roles land when they sign in.
Required role
All web-portal roles except Technician (who has a minimal mobile dashboard instead).
Overview
The Dashboard is a single-page situational-awareness view. It answers "how's today going?" at a glance. The date-range picker at the top controls every widget on the page — by default it shows today; you can zoom out to a week, month, or custom range for trend views.
What the Dashboard shows depends on your role:
- Supervisors see assignment and approval queues prominently.
- Managers see completion rates, OEE indicators, and technician performance.
- Admins see all of the above plus a system-health indicator.
- Mappers see hierarchy coverage metrics.
- Viewers see the same widgets as Managers but cannot act on any of them.
- PegotecUser sees the dashboard of whichever company they've switched into.
Opening the Dashboard
The Dashboard is always at the top of the sidebar menu. It's your landing page every time you sign in.
The date-range picker
A single control at the top of the page sets the time window for every widget:
- Today — default.
- Yesterday.
- Last 7 days.
- This month.
- Last month.
- Custom range — any two dates.
Your last-used range persists across sessions, so if you always want "this week", set it once.
Remember what range you're in
It's easy to open the Dashboard on Monday morning, still see the range set to "last week", and draw the wrong conclusion. Glance at the date-range label before you draw conclusions.
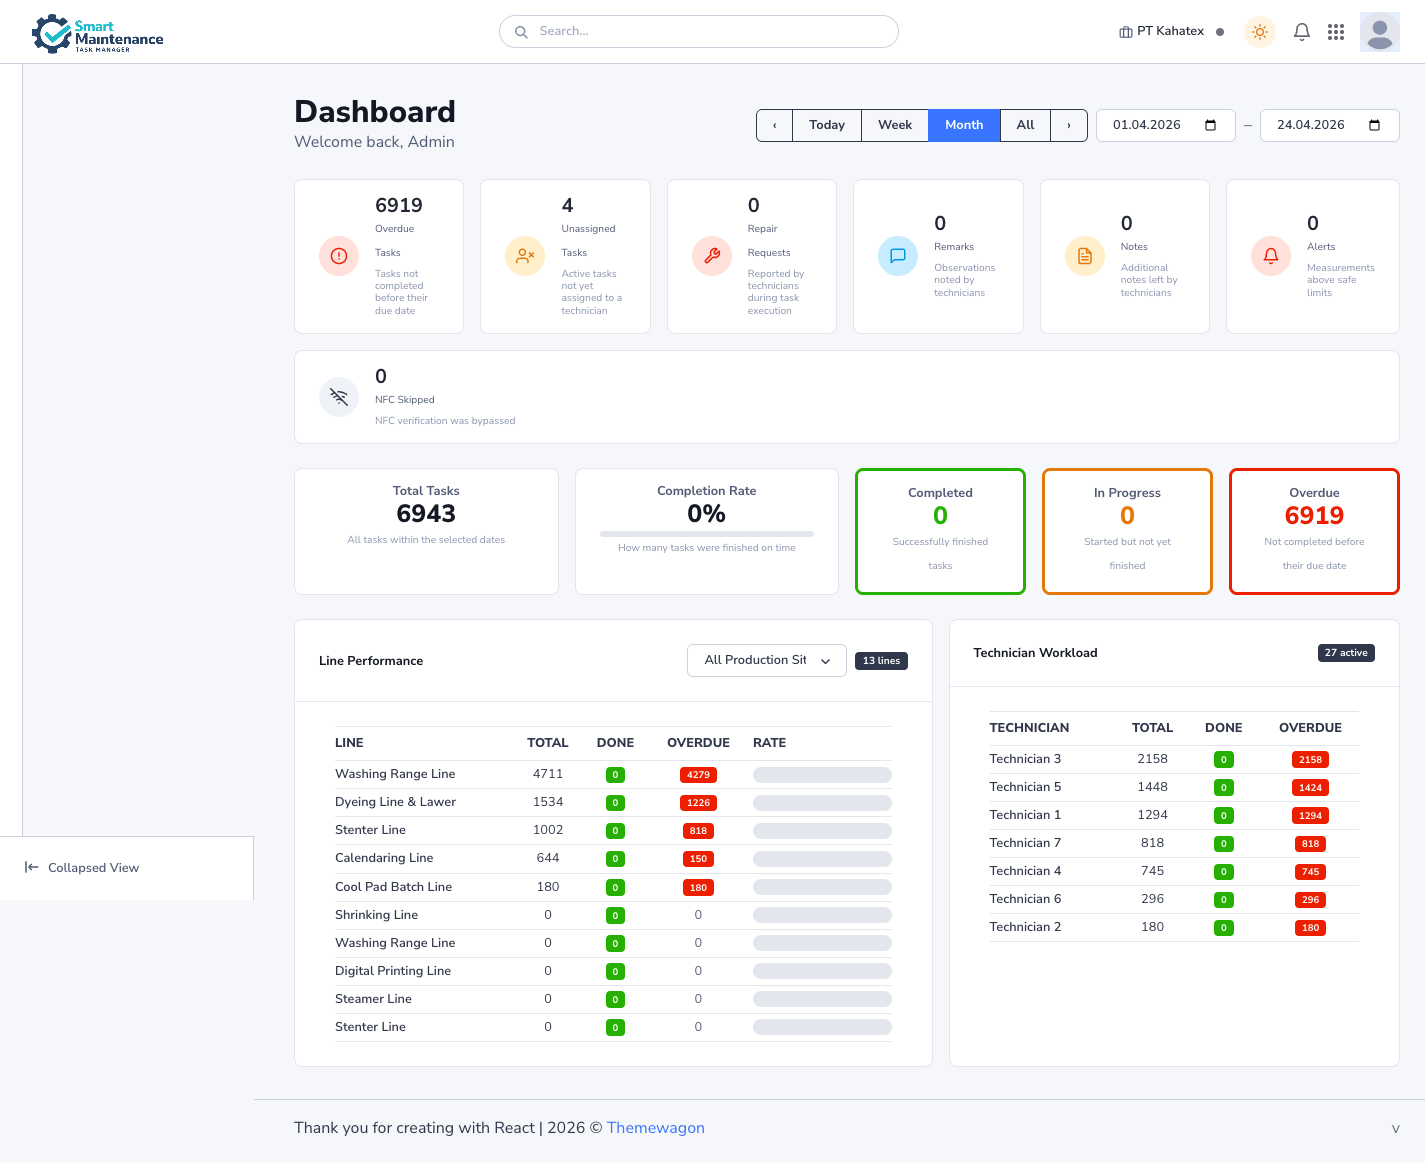
Widgets
Quick-indicator cards
A row of seven icon cards summarises key counters for the selected range. Each is clickable and drills into the relevant list.
| Card | What it counts |
|---|---|
| Overdue Tasks | Tasks not completed before their due date. |
| Unassigned Tasks | Active tasks not yet assigned to a technician. |
| Repair Requests | Repair requests reported by technicians during task execution. |
| Remarks | Observations noted by technicians. |
| Notes | Additional notes left by technicians. |
| Alerts | Measurements above safe limits. |
| NFC Skipped | NFC verification that was bypassed. |
Below the card row, five status blocks summarise the overall task pipeline:
- Total Tasks — all tasks within the selected dates.
- Completion Rate — completed ÷ assigned, with a progress bar.
- Completed — successfully finished.
- In Progress — started but not yet finished.
- Overdue — not completed before their due date.
Completion rate over time
A line or bar chart showing completion rate for each day / week / month in the selected range. Useful for spotting trends — a slow decline is often the first visible signal that something operational has slipped.
Technician performance
A table of technicians, one row each, with columns for:
- Tasks assigned.
- Tasks completed.
- Completion rate.
- Average time-to-completion.
- Rejection rate.
Sort by any column. Click a row to drill into that technician's activity. This is where Supervisors and Managers spot coaching opportunities or imbalances.
Line availability
A table or chart per production line, with uptime percentage and total downtime in the selected range. Cross-references the Shutdown data.
Open items
Quick counts of:
- Pending approvals (your queue, if you're a Supervisor / Admin).
- Open repair requests.
- Active shutdowns.
Each is clickable — jump straight to the list.
Real-time updates
The Dashboard subscribes to a WebSocket channel and updates its widgets live:
- A new task submission increments the Pending approval count.
- An approval moves a task out of pending into completed.
- A new repair request increments the open-items count.
- A reported shutdown flashes the affected line.
If the WebSocket connection drops, the indicator in the header turns orange; refresh the page to resync.
Drilling down
Most widgets are clickable:
- Click a count → go to the relevant list (e.g. Overdue → tasks filtered to overdue).
- Click a technician row → their personal detail page.
- Click a line in Line Availability → the line's hierarchy page.
This is faster than navigating through the sidebar.
Customisation
Some installations let you pin / unpin widgets or reorder them. Click the settings icon at the top-right of the Dashboard to open the customisation panel (if present).
Layout preferences persist per user.
How widgets compute their numbers
The exact definitions are worth knowing:
| Metric | Definition |
|---|---|
| Assigned | Tasks scheduled to occur in the window. |
| Completed | Tasks submitted and approved within the window. |
| Overdue | Tasks whose due time is in the past and whose status is not Approved. |
| Pending approval | Submitted tasks with status "Pending". |
| Completion rate | Completed ÷ Assigned × 100. |
| Time-to-completion | Submission time minus assignment time, averaged. |
| Rejection rate | Rejections ÷ (Submissions) × 100. |
If numbers look wrong, start with filters and definitions — the numbers are almost always right; what's often wrong is your assumption about which window or metric you're looking at.
Printing / exporting
The Dashboard doesn't have a native export, but all its underlying data is available via individual reports:
- Reports → Completion Report for completion metrics.
- Reports → Technician Comparison for the technician table.
- Reports → Asset Availability for line uptime.
Filter each report to the same date range as the Dashboard to reproduce the view in exportable form.
Things to watch for
Don't panic on a slow day
A single low-completion morning doesn't mean the team's broken. Zoom out before drawing conclusions. Look at the 7-day view.
Pending approvals bloat completion rate
If your approval queue is backed up, the dashboard underreports completion. Clear approvals regularly to keep the Dashboard honest.
Timezone
All dates are rendered in your company's configured timezone (see Profile and settings). If you're working across timezones, this is worth double-checking.
Troubleshooting
| Problem | Fix |
|---|---|
| Dashboard looks empty | Check the date range first |
| A widget is missing | Your role may not have access — Permissions matrix |
| Numbers don't match a report | Check both have the same date range and filters |
| Updates aren't flowing live | See Sync is stuck or failing (WebSocket section) |
| Dashboard is slow | Performance is slow |
Related topics
- Reports — detailed and exportable equivalents.
- Approving tasks — clearing the pending-approval queue.
- Assigning tasks — upstream of the assignment counts.
- Navigating the portal
- Icons and badges