Reports
Run, view, and export the platform's ten core reports. Every report supports a date-range filter, column sorting, and CSV / PDF export.
Required role
Supervisor, Manager, Admin, or Viewer — all with read and export access.
Overview
Reports turn the stream of task executions, repair requests, and shutdowns into answers:
- Are we keeping up with the plan?
- Who's struggling on the team?
- Which assets are costing us the most?
- Are we getting faster or slower?
The reports page lives under Reports in the sidebar. Each report has its own sub-page with filters tailored to its content.
Common controls
Every report shares a few controls:
- Date range — today / yesterday / last 7 days / this month / last month / custom. Your last-used range persists across sessions.
- Filters — site, line, technician, status, priority. Varies by report.
- Column sort — click any column header.
- Pagination — 25 / 50 / 100 / 250 rows per page.
- Export — CSV or PDF. The export reflects your current filter state.
The ten reports
1. Task Reporting
A drill-down operational report, starting at Lines and letting you drill to Assets → Sections → Task points → individual task instances.
The page has a From / To date range, a Print button (top-right), and a row of counter tabs across the top that filter the table below:
- All Tasks · Overdue · Repair · Remarks · Notes · Alerts · NFC Skipped
Each tab shows its current count and switches the table to that slice.
The table columns (at the Line level) are: Line / Assets / Total / Completed / In Progress / Overdue / Drill-into. Clicking the drill arrow on a row narrows you to that line's assets.
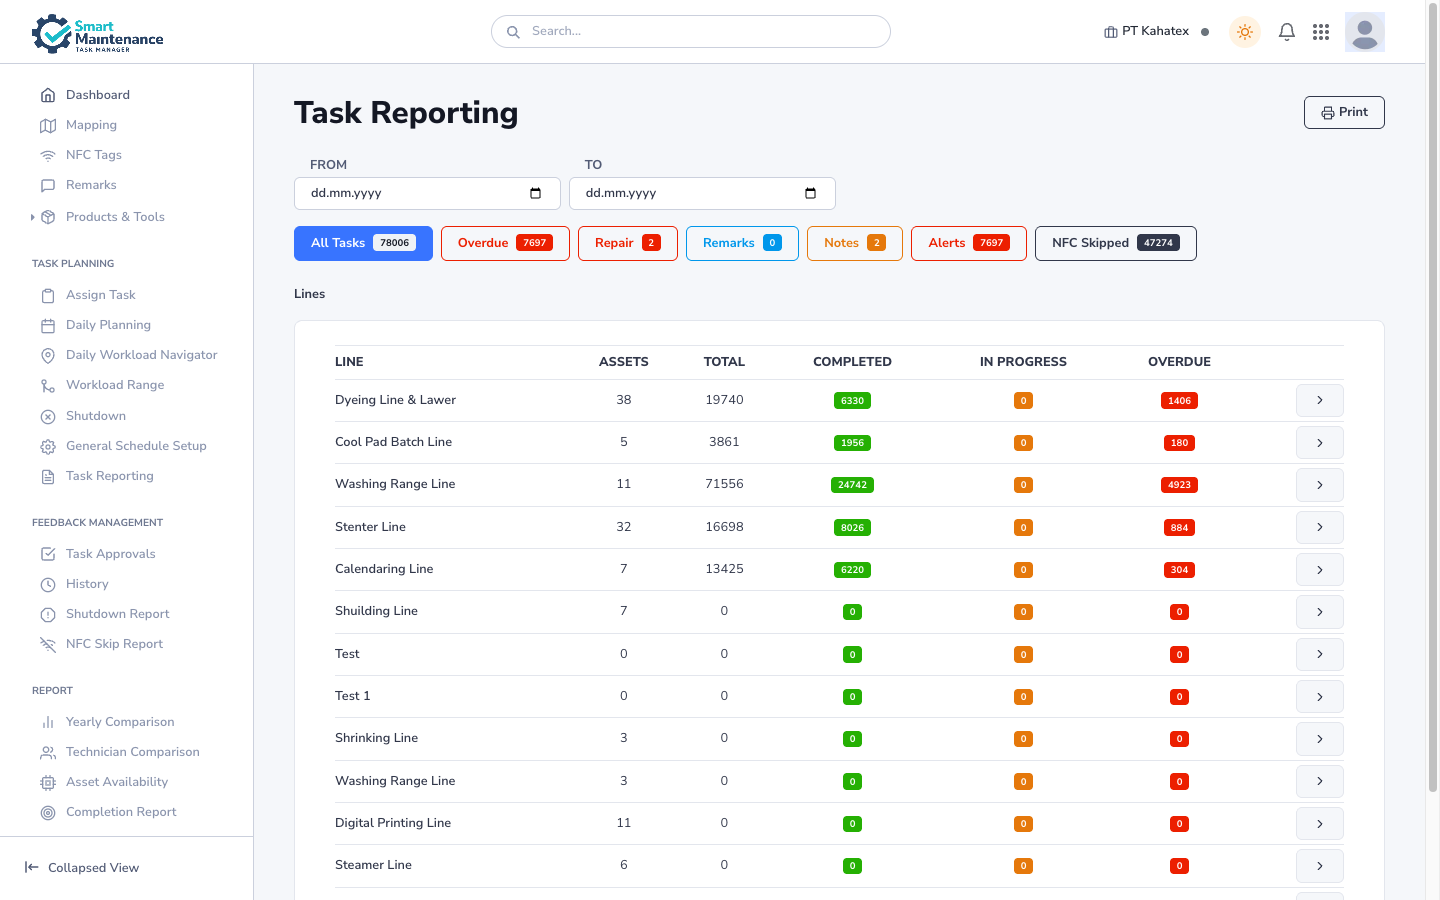
Use it for: operational drill-down on where work is happening and where it's stuck. Less a raw log than a roll-up you navigate.
2. Task History
Historical view with search and filter. Includes drafts and rejected tasks that Task Reporting omits.
Use it for: "what happened to that task last Tuesday?" style investigations.
3. Shutdown Report
One row per shutdown event.
| Column | Meaning |
|---|---|
| Start | Shutdown start time. |
| End | End time (blank if still active). |
| Duration | End minus start, in hours. |
| Line | Affected production line. |
| Reason | From master data shutdown-reason list. |
| Reported by | Technician who filed the report. |
| Resolved by | Who marked it resolved. |
Use it for: incident analysis; repeat-offender tracking; OEE-driver decomposition.
4. Yearly Report
Annual aggregated metrics. One row per month, columns for every major metric.
Use it for: board / exec summaries; year-over-year comparisons; capital planning.
5. Technician Comparison
One row per technician. Columns:
- Tasks assigned.
- Tasks completed.
- Completion rate.
- Average time-to-completion.
- Rejection rate.
- Overdue count.
Use it for: performance reviews; identifying coaching opportunities; rebalancing workload.
Context matters
A technician with a low completion rate may be covering the hardest assets. Always read the numbers alongside the shift mix and asset complexity.
6. Asset Availability
Uptime percentage and downtime hours per asset, over the selected range.
Use it for: identifying the assets that drag your OEE down; capital replacement decisions.
7. OEE Report
Overall Equipment Effectiveness — the combined Availability × Performance × Quality metric used in manufacturing.
- Availability — uptime / planned production time.
- Performance — actual output / theoretical maximum output (if your tasks capture output).
- Quality — good units / total units (if captured).
Use it for: executive-level performance tracking; cross-site / cross-line comparisons.
OEE needs Production tasks
The Performance and Quality components depend on Production task executions that capture output numbers. If your team doesn't run Production tasks, the OEE report falls back to Availability only.
8. Completion Report
Completion rate broken down by line, asset, or technician.
Use it for: quick "are we on plan?" checks; spotting under-performing segments.
9. Repair Request Report
One row per repair request.
| Column | Meaning |
|---|---|
| Submitted | When the technician raised it. |
| Asset | Affected asset. |
| Failure type | From master data. |
| Priority | Low / Medium / High / Critical. |
| Status | Submitted / Acknowledged / In progress / Resolved / Closed. |
| Resolution time | Time from submitted to resolved. |
| Parts used | If the resolution captured parts. |
Use it for: failure-pattern analysis; cost attribution; backlog tracking.
10. Flowchart
A visual process-flowchart display of the asset hierarchy. Less a report than a navigation aid for users who think in pictures rather than trees.
Use it for: explaining the plant layout to visitors; annotating review documents.
Exporting
Every report supports three export formats:
- CSV — raw tabular data. UTF-8, comma-delimited,
\nline terminator. - PDF — print-ready with company logo, date range, and active filters in the header.
- XLSX — formatted Excel workbook with coloured status cells, frozen headers, and multiple sheets for multi-dimension reports (e.g. the OEE report ships separate sheets per line).
The export reflects your current filter state. Re-apply filters and re-export for a different slice.
Quick export vs background job
Small exports (< ~5,000 rows) generate immediately and download in your browser. Large exports (OEE across a year, Task Reporting for a large plant) run as background jobs:
- Click the export button.
- The portal acknowledges: "Your export is being generated."
- A notification appears in your bell when ready (typically within a minute or two).
- Click the notification to download, or find the file under Reports → Exports.
Exports are single-download and expire
Background-exported files are deleted from the server after one successful download. If you need to share the file with colleagues, save it locally first and redistribute yourself. Un-downloaded files also auto-expire after 7 days — download and archive locally if you need long-term retention.
Export rate limit
To protect the platform from runaway export jobs, each user is rate-limited to 20 export requests per hour. Exceeding this returns an error:
Too many export requests. Please try again in X minutes.
The 20 resets on a rolling hour. If you need to run more than 20 exports (a mass audit, a year-end package), spread them across multiple hours or split the work between several users. Rate limits are per-user, not per-company.
API vs portal exports
If your installation exposes report exports through the API (for BI integrations), the API endpoints return XLSX only — not CSV or PDF. The portal's CSV / PDF buttons are portal-only. Integrations that need CSV should consume the XLSX file and convert.
CSV format
- Encoding: UTF-8 with BOM (Excel-friendly on Windows).
- Delimiter: comma.
- Quoting: only fields containing commas, quotes, or newlines.
- Line terminator:
\n. - Header row: always included.
- Numeric columns: raw — no thousands separators, no currency symbols, no units.
- Dates: ISO 8601 (
2026-04-24T09:30:00+07:00) in UTC. - Booleans:
true/false. - Empty cells: empty string, not the word
null.
To open cleanly in Excel on Windows, use Data → From Text with UTF-8 encoding rather than opening the file directly.
PDF format
- Paper size: A4 (configurable in company settings).
- Orientation: portrait for summary reports, landscape for wide tables.
- Header: company logo, report name, date range, active filters.
- Body: the table — paginated across pages if it doesn't fit on one.
- Footer: page number, generated-at timestamp, user who ran the export.
XLSX format
- Workbook sheets: one per logical grouping. OEE: one sheet per line. Task Reporting: a single sheet unless your export exceeds 1,000,000 rows.
- Conditional formatting: status cells coloured (overdue red, completed green, pending amber), threshold-violation values highlighted.
- Frozen panes: header row and first column stay visible while scrolling.
- Auto-width: columns sized to content for readability.
- Formulas: none — values are baked in. If your BI tool needs live formulas, CSV is better.
- Cell formats: dates as Excel date-time, numerics as numbers (not strings), booleans as Excel TRUE / FALSE.
XLSX is the best format for sharing with stakeholders who want to sort, filter, and annotate in Excel without writing formulas.
PDF consumption
Ready to print or attach to an email. Includes:
- Report title and date range.
- Applied filters.
- The table.
- A footer with the company name and timestamp.
Who sees what
- Manager — all reports, export.
- Supervisor — all reports, export.
- Admin — all reports, export.
- Viewer — all reports, export (read-only in the rest of the portal but reports are always read-only anyway, so Viewer's experience is full here).
Reports don't expose data outside your company's scope. PegotecUser can switch companies via the header switcher and run the reports on the switched-into tenant.
Performance tips
Some reports (OEE, Yearly) are heavy. If a report is slow:
- Narrow the date range.
- Filter to a single site or line.
- Export and analyse in Excel rather than scrolling in the browser.
See Performance is slow.
Things to watch for
Approval backlog distorts numbers
A report's "Completed" count only includes tasks that have been approved, not just submitted. If the approval queue is deep, the numbers understate actual completions. Clear approvals regularly.
Always include the date range on shared exports
Before you email a PDF upstairs, add the date range to your message. A report taken out of context is easy to misread.
Data lags real time slightly
A task submitted seconds ago may not appear in a report until its approval is processed. For operational awareness, use the Dashboard; for analytical queries, reports are right.
Troubleshooting
| Problem | Fix |
|---|---|
| Report is empty | Check date range and filters first |
| Numbers don't match the Dashboard | Ensure both have the same filter state |
| Slow to load | Narrow the range or export to CSV |
| CSV opens with wrong encoding | Open via Data → From text in Excel; pick UTF-8 |
| Column missing | Your role may not have access to that column |
Related topics
- Dashboard — operational-time equivalent.
- Navigating the portal
- Manager handbook — how Managers use these reports day-to-day.
- Supervisor handbook — how Supervisors use them.
- File formats — CSV / PDF export details.
- Performance is slow