Workload Range
A per-technician workload table across a date range, with drill-down into each technician's work.
Required role
Supervisor, Admin, Manager, Mapper, or Viewer (with task.view).
Overview
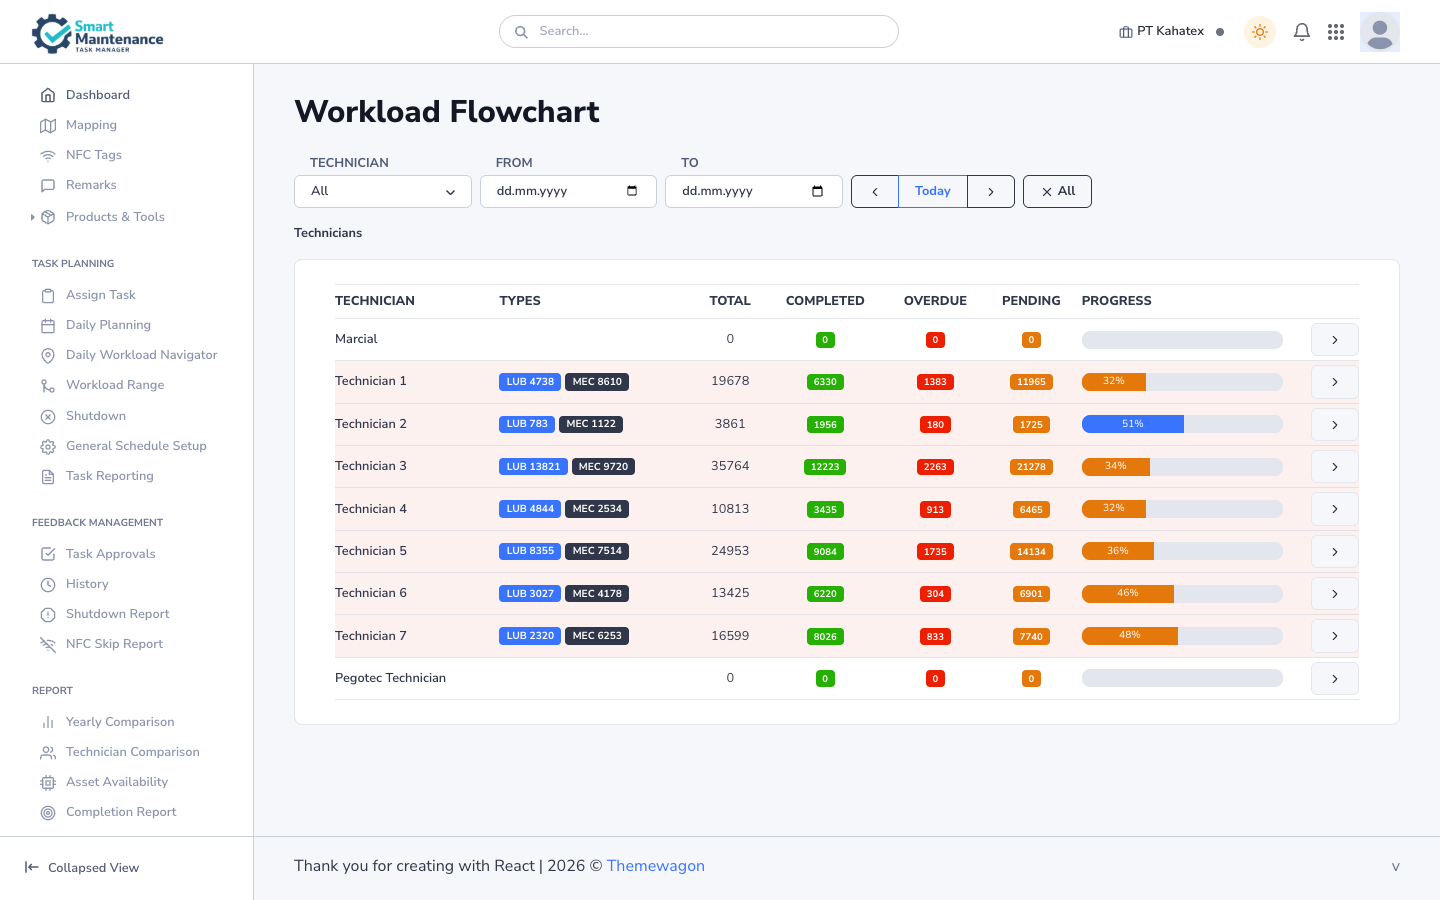
Workload Range (page title: Workload Flowchart) is the longer-range view of team workload. Where Daily Workload Navigator shows where today's work sits in the plant, Workload Range shows each technician's total load over a date range — how many tasks, of which types, completed / overdue / pending.
Use it for:
- Weekly / monthly load review.
- Spotting overloaded vs underloaded technicians.
- Pre-shift planning ("how's next week shaped for each person?").
Open the page
Task Planning → Workload Range in the sidebar. URL: /flowchart.
Layout
- Filters: Technician, From date, To date, ◀ Today ▶ (day stepper), All (reset).
- Breadcrumb: Technicians (indicates you're at the technician level).
-
Table: one row per technician, with columns:
Column Meaning Technician Name. Types Per-task-type counts (e.g. LUB 4738/MEC 8610).Total Total tasks in the date range. Completed Completed count. Overdue Overdue count. Pending Pending count (not started, not completed, not overdue). Progress Progress bar + percentage. Drill into … Arrow button to drill from technician → line → asset.
Steps
1. Pick a date range
Use the From and To date fields, or step by day with ◀ Today ▶. Click All to clear filters back to default.
2. Scan the table
Sort or filter by any column. Look for:
- High overdue counts — which technicians have a backlog?
- Low completion progress — which technicians are behind?
- Type imbalance — is one person doing nothing but lubrication while others do mechanical?
3. Drill into a technician
Click the drill-down arrow in the rightmost column to see that technician's work broken down by line, asset, or task point.
4. Act
- Reassign work via Assign Task.
- Adjust schedules via General Schedule Setup.
- Flag coaching moments via performance review (the Workload Range is the operational half of the story; the Technician Comparison report is the analytical half).
How it differs from other views
| Question | Use |
|---|---|
| "What's happening by time / calendar?" | Daily Planning |
| "Where in the plant is today's work?" | Daily Workload Navigator |
| "How are technicians loaded over a range?" | Workload Range (this page) |
| "Who's performing well / poorly across months?" | Technician Comparison report |
Things to watch for
Use the drill-down to find patterns
The table surfaces totals; drilling down surfaces causes. A technician with a high overdue count — drilling in often shows it's one specific line or task class, not broad.
Date range is task-instance-based
The counts are across task instances scheduled within the range — not tasks completed within the range. A task scheduled for May 1 and completed late on May 5 appears in a range that includes May 1 but completion is under Completed.
Related topics
- Daily Planning
- Daily Workload Navigator
- Assign Task — reassignment.
- Reports › Technician Comparison — analytical twin.
- Supervisor handbook
- Manager handbook